PyQtGraph 绘图
数据绘图方案
Python语言 的数据可视化(绘图) 方法,常见的有 Matplotlib 和 PyQtGraph
- Matplotlib
说到 Python语言 的数据作图, Matplotlib 当然是最有名的。
优点: 功能完备、成熟稳定、社区生态圈庞大。
缺点: 某些作图场景性能不高。
- PyQtGraph
PyQtGraph 是基于Qt 的纯Python 库。
优点: 大数据量的作图性能高于 Matplotlib, 动态更新图的性能也比Matplotlib高。
并且和Qt图形界面框架完美融合,因为它的2D作图就是基于Qt的 Graphics View Framework 开发的。
缺点: 作图功能没有Matplotlib多,开发社区没有Matplotlib大。
那么,我们应该使用哪种方案呢?我的建议是:
如果你已经使用Qt开发图形界面程序了,并且作图功能是PyQtGraph支持的, 建议使用 PyQtGraph,因为它和Qt界面无缝结合。
否则 使用 Matplotlib。
本文先介绍 PyQtGraph 的使用示例。
PyQtGraph 安装
官方文档 和 案例
PyQtGraph 官方文档可以点击这里查阅
其中包含了很多示例代码,我们只需运行如下代码,即可查看这些demo和对应的代码
曲线图 示例
下面是一个最常见的 根据x/y轴对应的值 作曲线图的例子
import pyqtgraph as pg

# 创建 一个绘图控件类 PlotWidget 对象,作为顶层控件
# PlotWidget 间接继承 QtWidgets.QGraphicsView

pw = pg.plot()

# 设置图表标题、颜色、字体大小
pw.setTitle("气温趋势",color='teal',size='12pt')

# 背景色改为白色
pw.setBackground('w')

# 显示表格线
pw.showGrid(x=True, y=True)

# 设置上下左右的label
# 第一个参数 只能是 'left', 'bottom', 'right', or 'top'
pw.setLabel("left", "气温(摄氏度)")
pw.setLabel("bottom", "时间")

# 设置Y轴 刻度 范围
pw.setYRange(min=-10,  # 最小值
             max=50)  # 最大值

# 创建 PlotDataItem ,这种类型是画 曲线 Curve 和 散列点 scatter plots 的
curve = pw.plot( pen=pg.mkPen('b')) # 线条颜色

hour = [1, 2, 3, 4, 5, 6, 7, 8, 9, 10]
temperature = [30, 32, 34, 32, 33, 31, 29, 32, 35, 45]

curve.setData(
    hour, # x坐标
    temperature  # y坐标
)

pg.Qt.exec_()
清除画图区,重新绘制
如果使用新的数据再次绘图,可以先调用clear方法清除原来的内容(plotitem),如下
# 清除原来的plot内容
pw.clear()

# 创建 PlotDataItem ,缺省是曲线图
curve = pw.plot( pen=pg.mkPen('b')) # 线条颜色
hour = [1, 2, 3, 4, 5, 6, 7, 8, 9, 10]
temperature = [130, 132, 134, 132, 133,131, 129, 132, 135, 145]

curve.setData(hour, # x坐标
              temperature  # y坐标
              )
PlotWidget 和 GraphicsLayoutWidget
PyQtGraph 中 绘图控件类 有两种 PlotWidget 和 GraphicsLayoutWidget, 都是 GraphicsView 子类。GraphicsView 是 Qt 的 QGraphicsView 子类,在其基础上改进了一些功能。
PlotWidget 只能内置一个 绘图对象PlotItem, 而 GraphicsLayoutWidget 可以内置多个 绘图对象。 通常我们使用最多的是PlotWidget
PlotWidget对象的 内置绘图对象 PlotItem ,可以通过 getPlotItem() 方法获取。
为了方便,大部分的PlotItem方法都可以直接通过 PlotWidget对象调用。 比如我们上面示例代码中的 setTitle、showGrid、setLabel、setYRange、plot 等。
调用 plot方法,会创建一个PlotDataItem, 缺省是曲线图
关于PyQtGraph绘图基本架构的更多细节,点击这里查看官方文档
嵌入到Qt程序界面中
上面的例子,图表是在单独的程序中运行显示。
如果我们要把它 嵌入到我们的Qt程序界面 中,主要通过 pyqtgraph 的 PlotWidget 或者 GraphicsLayoutWidget 控件类, 代码如下所示
from PySide2 import QtWidgets
import pyqtgraph as pg

class MainWindow(QtWidgets.QWidget):

    def __init__(self):
        super().__init__()

        self.setWindowTitle('pyqtgraph作图示例')

        # 创建 PlotWidget 对象
        self.pw = pg.PlotWidget()

        # 设置图表标题
        self.pw.setTitle("气温趋势",color='#008080',size='12pt')

        # 设置上下左右的label
        self.pw.setLabel("left","气温(摄氏度)")
        self.pw.setLabel("bottom","时间")
        # 背景色改为白色
        self.pw.setBackground('w')


        hour = [1,2,3,4,5,6,7,8,9,10]
        temperature = [30,32,34,32,33,31,29,32,35,45]

        # hour 和 temperature 分别是 : x, y 轴上的值
        self.pw.plot(hour,
                     temperature,
                     pen=pg.mkPen('b') # 线条颜色
                    )

        # 创建其他Qt控件
        okButton = QtWidgets.QPushButton("OK")
        lineEdit = QtWidgets.QLineEdit('点击信息')
        # 水平layout里面放 edit 和 button
        hbox = QtWidgets.QHBoxLayout()
        hbox.addWidget(lineEdit)
        hbox.addWidget(okButton)

        # 垂直layout里面放 pyqtgraph图表控件 和 前面的水平layout
        vbox = QtWidgets.QVBoxLayout()
        vbox.addWidget(self.pw)
        vbox.addLayout(hbox)

        # 设置全局layout
        self.setLayout(vbox)

if __name__ == '__main__':
    app = QtWidgets.QApplication()
    main = MainWindow()
    main.show()
    app.exec_()
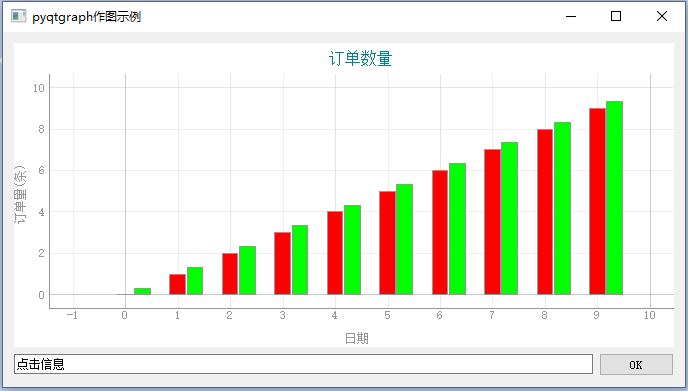
柱状图
pyqtgraph 可以产生这样的 柱状图
from PySide2 import QtWidgets
import pyqtgraph as pg

class MainWindow(QtWidgets.QWidget):

    def __init__(self):
        super().__init__()

        self.setWindowTitle('pyqtgraph作图示例')

        # 创建 PlotWidget 对象
        self.pw = pg.PlotWidget()
        # 设置图表标题
        self.pw.setTitle("订单数量",color='#008080',size='12pt')
        # 背景色改为白色
        self.pw.setBackground('w')
        # 设置上下左右的label
        self.pw.setLabel("left", "订单量(条)")
        self.pw.setLabel("bottom", "日期")

        # 显示表格线
        self.pw.showGrid(x=True, y=True)


        # 产生两种柱状图数据,分别对应 红色柱 和蓝色柱
        x1 = [0, 1, 2, 3, 4, 5, 6, 7, 8, 9]
        y1 = [0, 1, 2, 3, 4, 5, 6, 7, 8, 9]
        x2 = [0.33, 1.33, 2.33, 3.33, 4.33, 5.33, 6.33, 7.33, 8.33, 9.33]
        y2 = [0.33, 1.33, 2.33, 3.33, 4.33, 5.33, 6.33, 7.33, 8.33, 9.33]

        bg1 = pg.BarGraphItem(x=x1, height=y1, width=0.3, brush='r')
        bg2 = pg.BarGraphItem(x=x2, height=y2, width=0.3, brush='g')

        # 添加到界面上
        self.pw.addItem(bg1)
        self.pw.addItem(bg2)


        # 创建其他Qt控件
        okButton = QtWidgets.QPushButton("OK")
        lineEdit = QtWidgets.QLineEdit('点击信息')
        # 水平layout里面放 edit 和 button
        hbox = QtWidgets.QHBoxLayout()
        hbox.addWidget(lineEdit)
        hbox.addWidget(okButton)

        # 垂直layout里面放 pyqtgraph图表控件 和 前面的水平layout
        vbox = QtWidgets.QVBoxLayout()
        vbox.addWidget(self.pw)
        vbox.addLayout(hbox)

        # 设置全局layout
        self.setLayout(vbox)

if __name__ == '__main__':
    app = QtWidgets.QApplication()
    main = MainWindow()
    main.show()
    app.exec_()
绘制多个图形
可以使用 GraphicsLayoutWidget,创建多个绘图对形
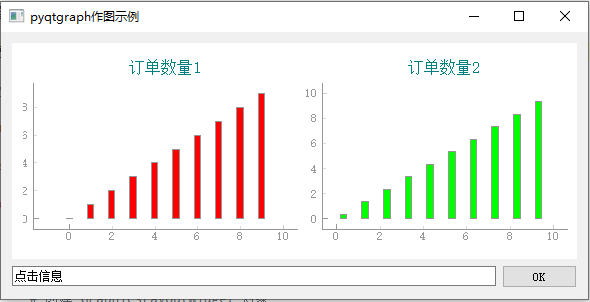
对应代码如下
本节内容 仅 内部学员 可见
实时更新图
要画动态的实时更新图,只需要在把变更的内容重新plot即可。
示例代码如下
from PySide2 import QtWidgets
from pyqtgraph.Qt import  QtCore
import pyqtgraph as pg
import sys
from random import randint

class MainWindow(QtWidgets.QMainWindow):

    def __init__(self):
        super().__init__()

        self.setWindowTitle('pyqtgraph作图')

        # 创建 PlotWidget 对象
        self.pw = pg.PlotWidget()

        # 设置图表标题
        self.pw.setTitle("气温趋势",
                         color='#008080',
                         size='12pt')

        # 设置上下左右的label
        self.pw.setLabel("left","气温(摄氏度)")
        self.pw.setLabel("bottom","时间")

        # 设置Y轴 刻度 范围
        self.pw.setYRange(min=-10, # 最小值
                          max=50)  # 最大值

        # 显示表格线
        self.pw.showGrid(x=True, y=True)

        # 背景色改为白色
        self.pw.setBackground('w')

        # 设置Y轴 刻度 范围
        self.pw.setYRange(min=-10, # 最小值
                          max=50)  # 最大值

        # 居中显示 PlotWidget
        self.setCentralWidget(self.pw)

        # 实时显示应该获取 PlotDataItem对象, 调用其setData方法,
        # 这样只重新plot该曲线,性能更高
        self.curve = self.pw.plot(
            pen=pg.mkPen('r', width=1)
        )

        self.i = 0
        self.x = [] # x轴的值
        self.y = [] # y轴的值

        # 启动定时器,每隔1秒通知刷新一次数据
        self.timer = QtCore.QTimer()
        self.timer.timeout.connect(self.updateData)
        self.timer.start(1000)

    def updateData(self):
        self.i += 1
        self.x.append(self.i)
        # 创建随机温度值
        self.y.append(randint(10,30))

        # plot data: x, y values
        self.curve.setData(self.x,self.y)

if __name__ == '__main__':
    app = QtWidgets.QApplication()
    main = MainWindow()
    main.show()
    app.exec_()
在Qt Designer中加入第三方控件
PyQtGraph图形可以作为一个 Qt的 widget控件,嵌入到 Qt 程序主窗口中。
我们可以在 Qt Designer 中把 PyQtGraph图形控件 作为第三方控件 加入。
比如,像下面这样:
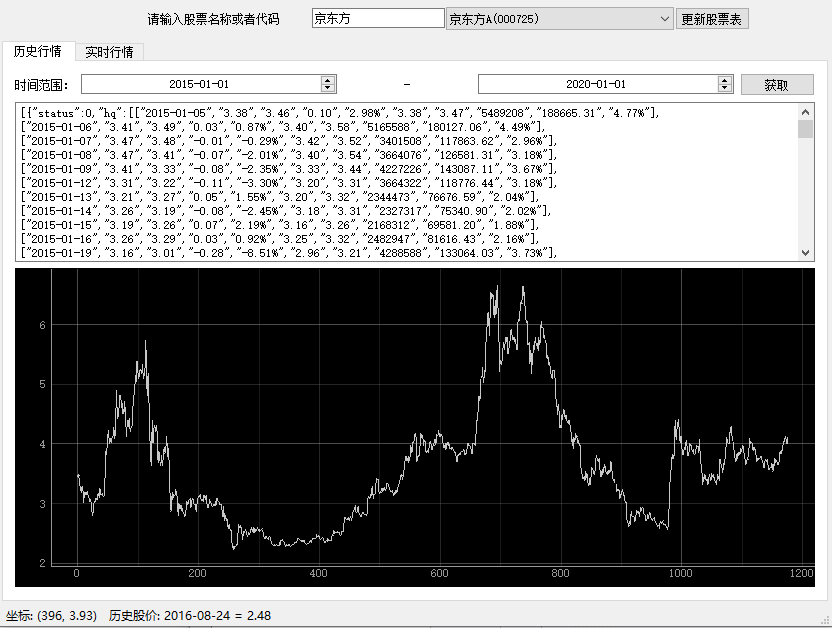
通过 Qt Designer,我们可以预先把界面上的控件的位置大小设计好,然后动态加载。
但是 界面上摆放的都是 Qt内置的控件, 那么像 PyQtGraph 里面的 PlotWidget这种第三方控件怎么 放到 Qt Designer中呢?
最简单的方法是: 通过 Qt Designer 放一个 第三方控件 的 上层layout, 然后在代码中 创建 第三方控件对象, 并且添加到 上层layout 里面去。
这在我们 实战班的 项目实战1 - 实战10 中有相应的锻炼。
当然也可以直接在 Qt Designer里面 放入第三方控件 ,这种方法其实更麻烦一些,如果你一定要这样做,可以点击这里,边看视频讲解,边学习如下内容
讲解视频,产生的界面ui文件在下面的链接zip文件中
https://cdn2.byhy.net/files/qt/stock-01.zip
如果你使用的是PySide2, 对应的代码如下,注意第14行 注册的作用
如果使用 PyQt5,就更简单了, 无需注册,对应的代码如下
from PyQt5.QtWidgets import QApplication
from PyQt5 import QtWidgets, uic

class Stock:

    def __init__(self):

        # PyQt5 直接加载ui文件
        # 因为 第三方控件通过promote的定义已经知道控件类所在模块的路径
        self.ui = uic.loadUi("main.ui")

        hour = [1,2,3,4,5,6,7,8,9,10]
        temperature = [30,32,34,32,33,31,29,32,35,45]
        self.ui.historyPlot.plot(hour, temperature)

app = QApplication([])
stock = Stock()
stock.ui.show()
app.exec_()
轴刻度为字符串
上面的程序运行起来, X轴的刻度是 数字, 如果我们希望轴刻度是文字怎么做呢?
我们参考了这个网址的介绍: https://stackoverflow.com/questions/31775468/show-string-values-on-x-axis-in-pyqtgraph?lq=1
需要定义从数字到字符串的映射列表,参考如下代码
import pyqtgraph as pg

# 刻度表,注意是双层列表
xTick = [[(0, 'a'), (1, 'b'), (2, 'c'), (3, 'd'), (4, 'e'), (5, 'f')]]
x = [0, 1, 2, 3, 4, 5]
y = [1, 2, 3, 4, 5, 6]

win = pg.GraphicsWindow()
stringaxis = pg.AxisItem(orientation='bottom')
stringaxis.setTicks(xTick)
plot = win.addPlot(axisItems={'bottom': stringaxis})
curve = plot.plot(x,y)

pg.QtGui.QApplication.exec_()
如果使用 PlotWidget,则要获取轴对象,参考代码如下
# self.ui.historyPlot 就是 PlotWidget对象
xax = self.ui.historyPlot.getAxis('bottom')
xax.setTicks(xTick)
获取鼠标所在处刻度值
有时候,我们的程序需要获取 鼠标在 pyqtgraph 图形上移动时,鼠标所在对应的数据是什么。
解决方法,仅供实战班学员参考
练习题
开发一个股票数据软件,题目要求见 这个视频说明
VIP实战班学员联系老师获取参考代码。